Results
Dot-it-Spot-it® Total Protein Assay
Greater Sensitivity to Protein: This method exhibits significantly better sensitivity to protein compared to existing methods. This constitutes a significant advantage in various research applications where sensitivity is of paramount importance.
High Compatibility: The method can effectively operate in the presence of various buffer additives essential for working with proteins. This compatibility enhances the applicability of the assay in diverse experimental conditions
Sensitivity
Specificity and compatibility
Protein-to-BSA variation
SENSITIVITY
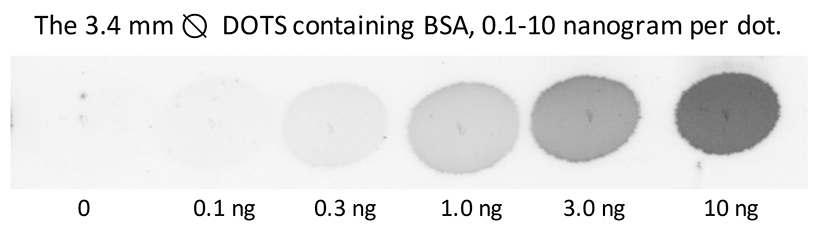
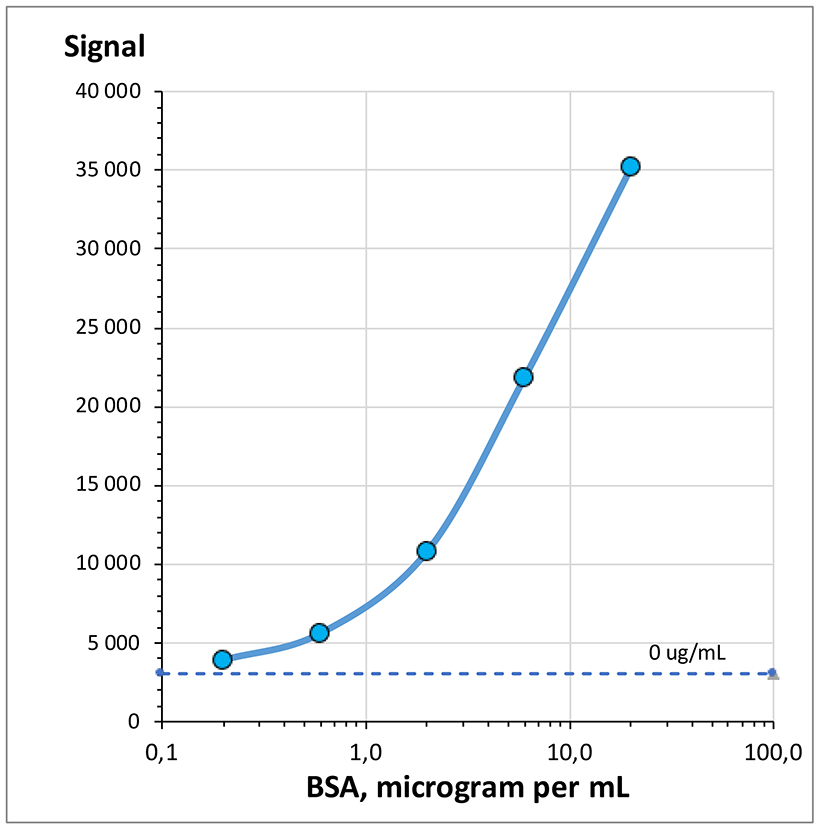
Standard curve for BSA
A. Semiquantitative detection by eye.
It is even possible by the naked eye to distinguish between 0 and 0.1 ng BSA per dot.
B. Quantitative detection.
The scanner Epson Perfection V600 Photo was used for quantification.
The graph shows BSA concentration in the sample vs. signal (blackness per pixel).
Detection limit in the sample: 0.18 μg BSA/mL .
Sample:
BSA (bovine serum albumin) standard was diluted between 0.2-20 μg BSA/mL in 0.03% Tween 20, 20 mM TRIS pH 7.5, 0.15 M NaCl.
Dot-it-Spot-it analysis:
Each 1 μL dot of application mixture contains 50% sample + 50% Dilution Buffer, 0.1-10 ng BSA per dot.
SPECIFICITY AND COMPATIBILITY
Sample buffer compatibility: Besides proteins, there are various essential components in sample buffers for extracting, dissolving, and storing proteins from biological samples. Total Protein Assays commonly used often face significant interference from these additional additives.
Incompatibility: As protein concentration decreases, more sample is required for analysis, exacerbating issues with non-compatibility. Consequently, many additives become impractical for use as they disrupt protein analysis.
We have the solution: The ultra sensitive Dot-it-Spot-it Total Protein Assay experiences significantly less interference from additives and provides greater sensitivity to proteins compared to current assays.
Regarding compatibility, please refer to the information in the tables as a reference only. It is the user’s responsibility to validate the compatibility of their specific sample buffer.
Singel additives: This table displays additives tested in TBS buffer with 1 mM EDTA. Additionally, except for the Detergent group, 0.03% Tween 20 was added. Both zero and BSA samples were analyzed. The result for the additive was deemed satisfactory if the results with and without the additive were similar.
Abbreviations
BFB: Bromophenol blue
BSA: Bovine serum albumin
BME: 2-Mercaptoethanol, beta-Mercaptoethanol
DOC: Deoxycholic acid
DTT: Dithiothreitol
EDTA: Ethylenediaminetetraacetic acid
GlcNAc: N-Acetylglucosamine
PMSF: Phenylmethylsulfonyl fluoride
SDS: Sodium dodecyl sulphate
TCEP: Tris(2-carboxyethyl)phosphine
PROTEIN-TO-BSA VARIATION
The protein-to-BSA ratio
Eight proteins, ranging in molecular weight from 12,000 to 150,000, were carefully chosen for analysis. Most of these proteins are glycoproteins, with three also containing hem groups. Their isoelectric points span from 3 to 11 pH units. The novel Dot-it-Spot-it method interacted with proteins in line with the two conventional tests.
Methods:
D: Dot-it-Spot-it, nano method
B: BCA, micro microplate method
C: Coomassie, micro microplate method
The average protein-to-BSA ratio for these eight proteins.